Dashboards
Custom visualizations, drill-downs, and filters.
Learn more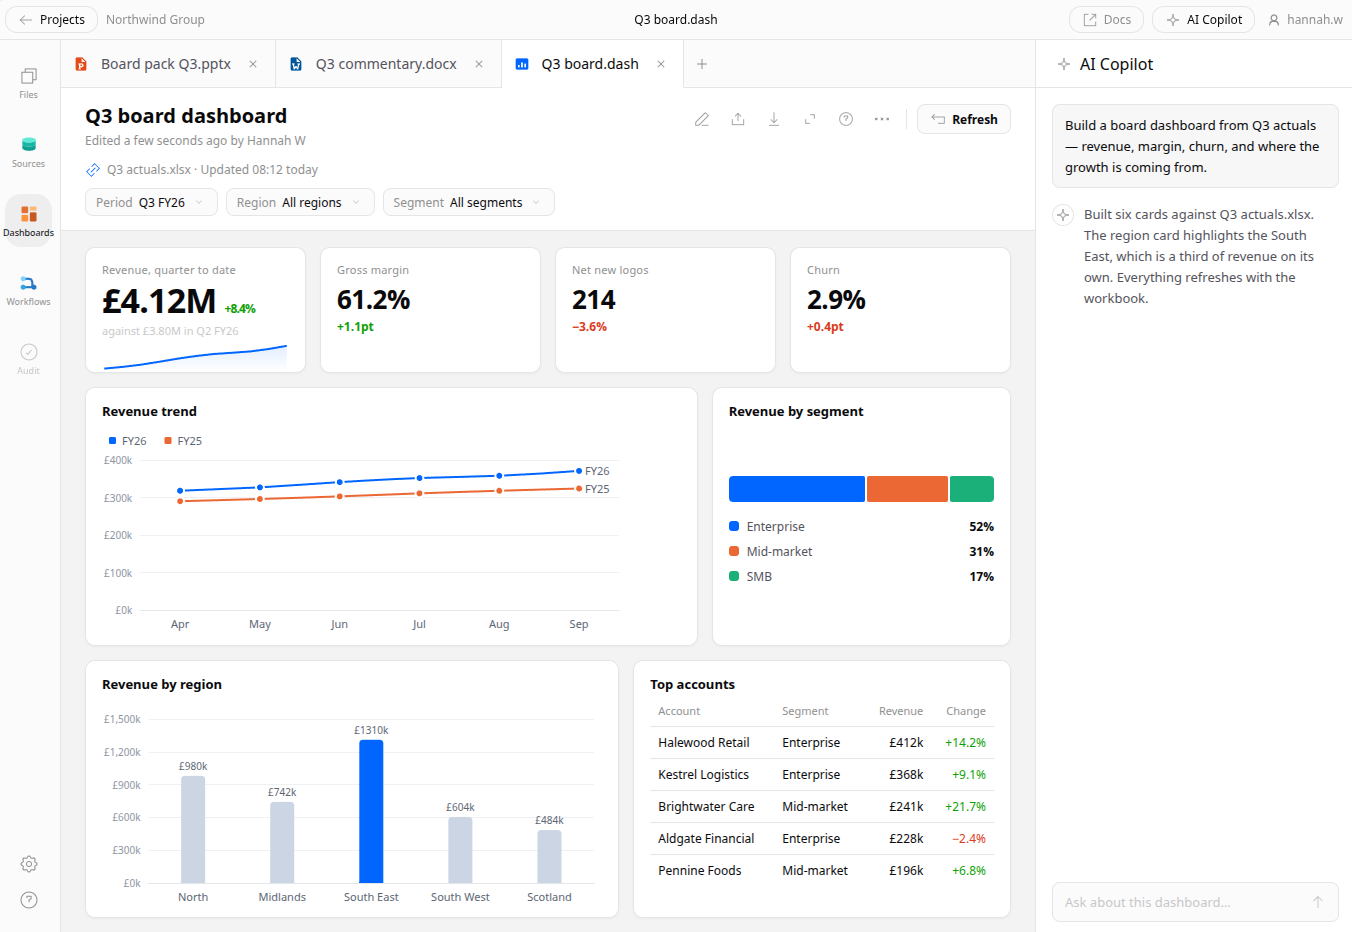
Query, model, report, automate — in the tools you already know.
Works with the stack you already run
That's up to 40% of the day lost to switching. They bounce between 8 disconnected tools just to go from raw data to a deliverable — and burn 65% of their time moving data, context, and formatting between them. Veritly closes that gap in five moves.
Toggle count and switching cost: Harvard Business Review, 2022.
Point Veritly at the databases, spreadsheets, CRM, and comms tools you already use.
Ask in the words you'd use with a colleague. Veritly writes the query and shows you exactly what it ran.
Turn the answer into a chart, report, or dashboard without leaving the conversation to open another tool.
Every query, chart, and model works everywhere else in the platform.
Turn any workflow into a scheduled job that runs on its own.
Watch a real question go from plain English to governed SQL and a client-ready chart, in a couple of minutes.
Learn moreCustom visualizations, drill-downs, and filters.
Learn moreDocs, sheets, slides, and PDFs on live, governed data.
Learn more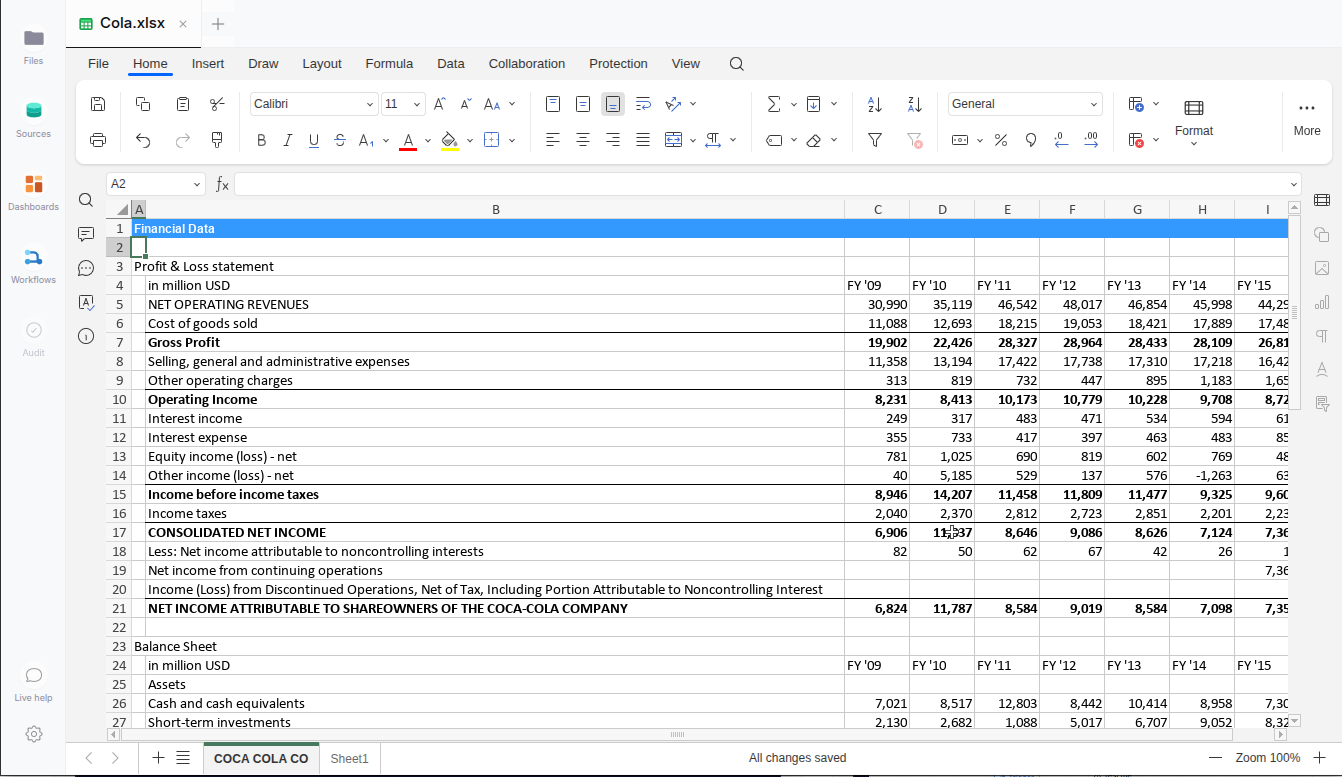
Ask in plain English. Veritly writes the query and the answer.
Learn more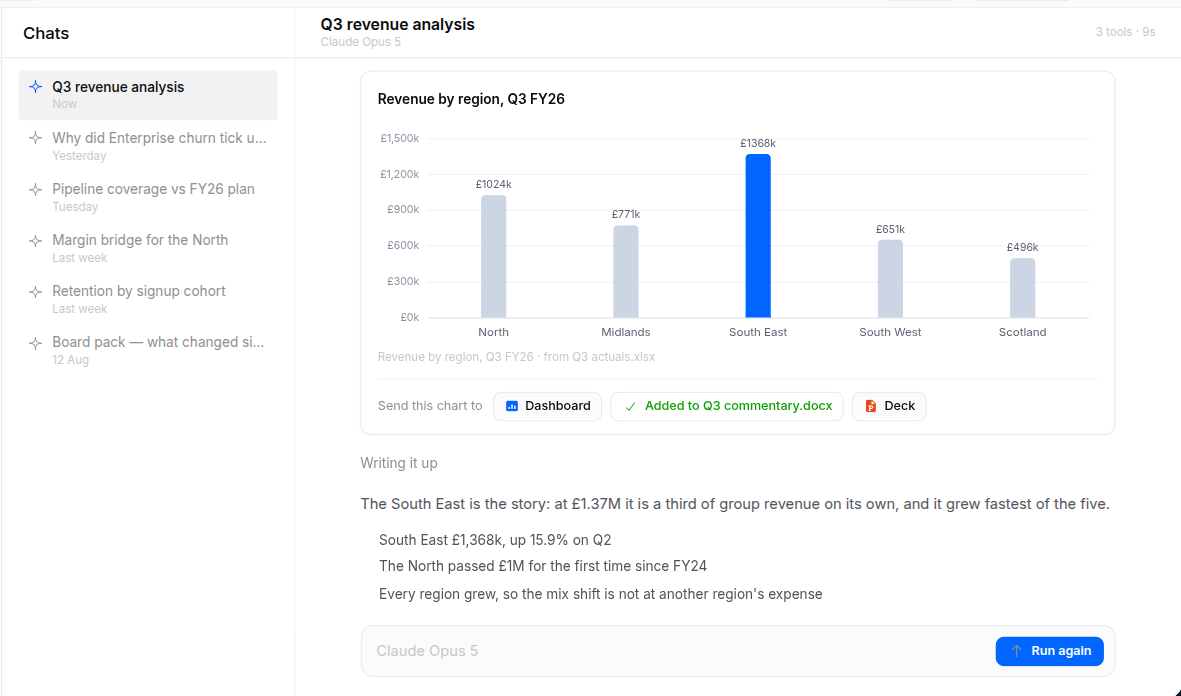
Connect steps into a pipeline. No code to maintain.
Learn more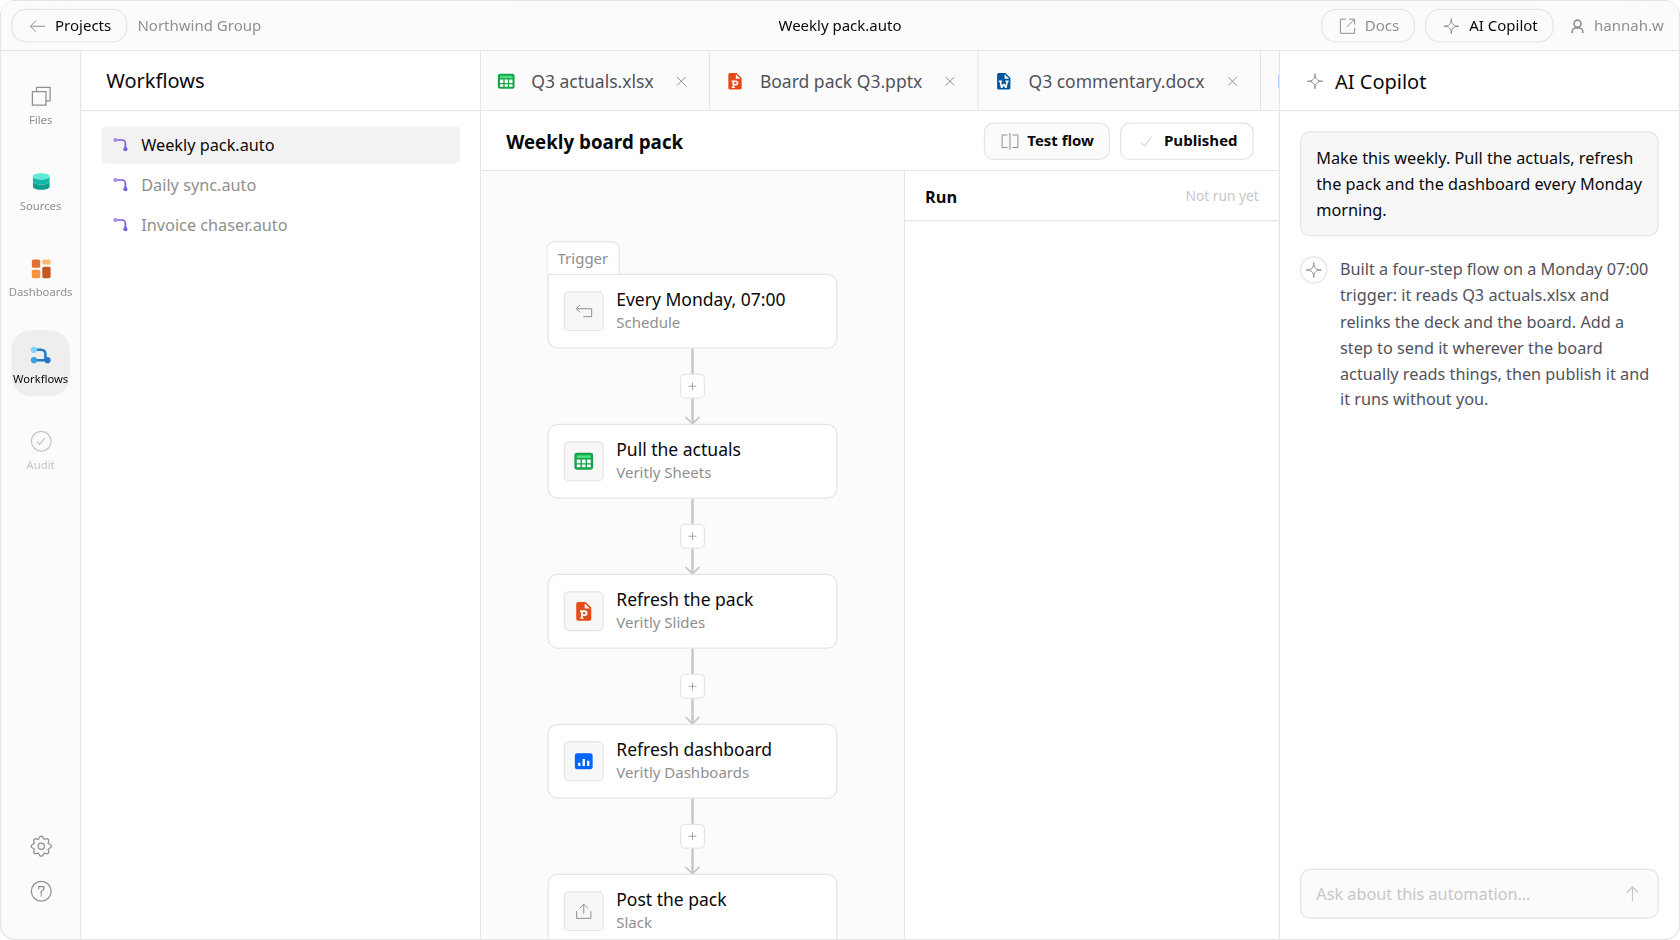
Every tool in a normal analytics stack works. The cost isn't any one of them — it's the seams between them, and the fact that the same metric has to be re-explained to each one. That's the 65% of the day that disappears.
One semantic model. Every dashboard, document, and job resolves through it.
Everything built on the metric updates with it, and you can preview what moves first.
The answer arrives with the query that produced it, so you can check the work.
They filter and drill it themselves, seeing only the rows you cleared them for.
The query behind a figure is one click away, on the dashboard and in the archive.
Query, model, document, publish, and schedule without leaving the platform.
Drowning in ad-hoc requests?
Define the metrics once. You own the definitions, and the people asking answer their own questions against them.
Tired of waiting three days for a number?
Get an answer straight from the chat, with enough behind it that you don't have to take it on faith.
Rebuilding the same report for every client?
Template the analysis, point it at a new dataset, and hand over a live dashboard instead of another static deck.
The recurring work — the Monday refresh, the month-end pack, the "can you just check" request — happens on schedule and flags you when something moved.
When a metric moves, Veritly decomposes it by segment and tells you which slice actually caused it.
Scheduled write-ups go out automatically on the schedule you set.
Ask from the chat and get the figure without breaking your flow to go find it.
Veritly reads from the warehouse you already run, so your data stays exactly where your security review already put it.
Row and column access is applied before results are returned, so a shared dashboard can't leak what the viewer was never allowed to see.
Tune a metric definition in isolation, check what it does to downstream reports, and merge only when it's right.
Each scheduled job records what ran, against which data, and what changed — the audit trail a client review actually needs.
The Integrated Analysis Environment is in private beta. Join the waitlist and we'll bring you in as capacity opens up.
A single workspace for querying, modelling, reporting, and automating analytics — all reading from the same governed connection to your warehouse, so a number defined once is the same number everywhere it appears.
No. Veritly connects to the warehouse you already run and builds a governed semantic model on top of it — your data stays where it is. Permissions are enforced at query time, inside the security perimeter you've already approved.
Veritly is in private beta. Join the waitlist and we'll bring you in as capacity opens up — early access includes a setup session with the team that built it.
Analysts, data teams, and consultancies who are tired of rebuilding the same report across a spreadsheet, a dashboard, and a slide deck every time the underlying data changes.
Row and column permissions are enforced before results are returned, so a shared view can't expose data the viewer was never cleared for — the same rules apply everywhere in the workspace.